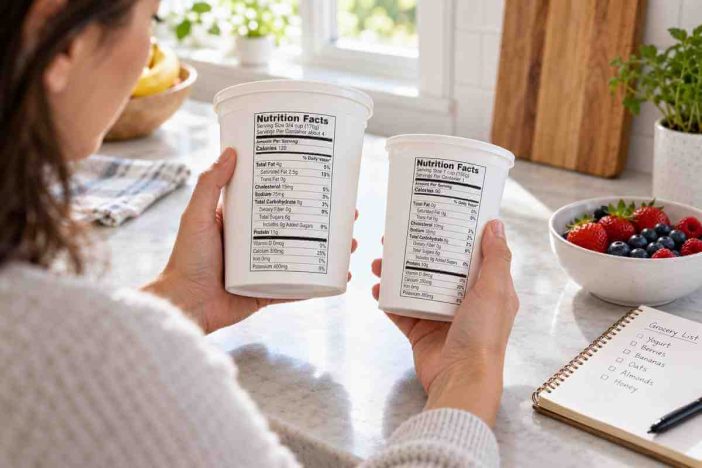
A shopper picks up two cartons of yogurt. One displays “15g protein” across the front. The other looks less impressive, with a smaller protein number and no prominent claim.
The first carton seems like the obvious choice.
But the comparison changes when one carton contains a larger serving, the other has less added sugar, and neither tells the shopper exactly what its protein number means for their daily needs.
The problem is not that the labels are useless. It is that protein grams, serving sizes, and Percent Daily Value answer different questions.
Once you understand those differences, you can compare ordinary foods without relying on marketing claims or complicated nutrition calculations.
How to Read Protein on Nutrition Labels in Four Steps
For most packaged foods in the United States, the process is straightforward:
- Find the serving size. Identify how much food the Nutrition Facts information represents.
- Read protein in grams. This tells you the labeled protein content of that serving.
- Check the % Daily Value if shown. Protein %DV is not required on every ordinary food label.
- Compare the rest of the food. Look at calories, saturated fat, sodium, added sugars, and fiber where relevant.
The order matters. A larger protein number does not automatically mean a product contains more protein in an equivalent amount of food.
According to the U.S. Food and Drug Administration’s guide to the Nutrition Facts label, serving size provides the reference point for interpreting the nutrient amounts that follow.
If you skip that first line, every comparison after it can be misleading.
Protein Grams vs Percent Daily Value: What Is the Difference?
The protein line on a Nutrition Facts label can contain two pieces of information.
Protein grams describe the amount of protein in one labeled serving.
Protein % Daily Value (%DV) describes how the protein contributes to an FDA reference value, accounting for applicable protein-quality rules.
They are related, but they are not interchangeable.
Protein grams describe quantity
Imagine two hypothetical products:
- Product A provides 12 grams of protein per labeled serving.
- Product B provides 18 grams of protein per labeled serving.
Product B lists more protein per serving.
That is all you can conclude before checking whether the servings represent similar quantities of food.
If Product A’s serving weighs 150 grams and Product B’s weighs 300 grams, the comparison becomes less straightforward.
Percent Daily Value provides a labeling reference
For adults and children ages four and older, the FDA’s general Daily Value for protein is 50 grams.
This number supports standardized nutrition labeling. It is not a personal protein prescription.
A person’s actual needs may differ depending on body size, age, activity, health status, and other factors.
The FDA also uses protein-quality-adjusted calculations when protein %DV is declared under the relevant food-labeling rules. That means the displayed protein percentage is not necessarily calculated by simply dividing the listed grams by 50.
For a full explanation of Daily Values, see the FDA’s Daily Value reference.
Why Is There No Protein % Daily Value on Some Labels?
This is one of the most confusing parts of U.S. food labels.
You might see:
Protein 8g
with no percentage alongside it.
That does not mean the product contains no meaningful protein, that its protein quality is necessarily poor, or that the manufacturer forgot an essential number.
For many ordinary foods intended for adults and older children, the FDA generally does not require protein %DV to appear unless particular conditions apply.
For example, protein %DV generally must be declared when a qualifying protein claim is made or when the product is intended for certain young-child populations.
The precise regulatory requirements depend on the product and its labeling.
The FDA’s guidance on low and high Percent Daily Values specifically advises consumers to use protein grams as a guide when protein %DV is absent.
Does a missing percentage mean the protein is low quality?
No.
The absence of protein %DV alone does not establish protein quality.
A missing percentage can simply reflect the labeling rules for the product.
To compare foods, start with the listed grams and the serving size. If you are evaluating a specific protein-quality claim, you may need additional product or nutritional information.
Does the 5% and 20% Daily Value rule apply?
The FDA generally describes 5% DV or less as low and 20% DV or more as high for nutrients with a listed Daily Value.
When a protein %DV is properly declared, it can help consumers interpret the product’s contribution to the labeling reference.
But you should not automatically turn every protein gram number into a displayed %DV yourself. Protein-specific labeling rules make that shortcut potentially inaccurate.
The Serving-Size Trap: Why 20 Grams Is Not Always More Impressive Than 15
Consider three imaginary yogurt products. These numbers are illustrative, not taken from commercial brands.
| Product | Labeled serving | Protein per serving | Protein per 100 g |
|---|---|---|---|
| Yogurt A | 150 g | 15 g | 10 g |
| Yogurt B | 200 g | 18 g | 9 g |
| Yogurt C | 100 g | 12 g | 12 g |
Yogurt B advertises the most protein per serving.
But Yogurt C contains the most protein relative to its weight.
Neither result proves that C is healthier than B. Both comparisons answer different questions.
When protein per serving is the useful number
Use it when you want to know how much protein you would get from eating the product’s stated serving.
For example, if you typically eat one complete individual yogurt container, its protein per container is useful information.
When protein per 100 grams is more useful
Use it when comparing similar foods packaged in substantially different portions.
The calculation is:
Protein per 100 g = (protein grams ÷ serving weight in grams) × 100
For Yogurt A:
15 ÷ 150 × 100 = 10 grams per 100 grams of food.
For Yogurt B:
18 ÷ 200 × 100 = 9 grams per 100 grams of food.
For Yogurt C:
12 ÷ 100 × 100 = 12 grams per 100 grams of food.
This provides a common basis for comparison.
However, protein per 100 grams is not always the best way to compare foods with very different water content, intended uses, or typical portions.
For instance, comparing a beverage with a dry snack mix using weight alone might not reflect how people actually consume them.
The Three-Number Protein Comparison
When deciding between two similar products, use three measurements.
1. Protein in the amount you will eat
Start with the labeled protein grams and adjust for your actual portion.
If a cereal contains 6 grams of protein per 40-gram serving and you eat 60 grams, the proportional estimate is:
6 × (60 ÷ 40) = 9 grams of protein.
Because Nutrition Facts amounts are subject to rounding, the result is an estimate rather than a laboratory measurement.
2. Protein per equivalent quantity
Compare products using the same weight or another suitable equivalent amount.
This helps identify whether a bigger protein claim is simply associated with a larger serving.
3. The rest of the nutritional profile
Check whether the product also supplies nutrients you want more of or substantial amounts of nutrients you may want to limit.
For many adults, fiber, saturated fat, sodium, and added sugars can be relevant considerations.
The goal is not to find the product with the largest protein number. It is to understand what you are getting in the context of your overall diet.
A Fair Comparison of Two Protein Snack Bars
Imagine two fictional snack bars.
| Label information | Bar A | Bar B |
|---|---|---|
| Serving size | 40 g | 60 g |
| Calories | 180 | 240 |
| Protein | 12 g | 15 g |
| Added sugars | 2 g | 8 g |
| Saturated fat | 4 g | 2 g |
| Fiber | 5 g | 3 g |
Bar B has more protein per bar.
But Bar A provides more protein per 100 grams and fewer calories per labeled bar.
Bar A also has less added sugar and more fiber per bar, while Bar B has less saturated fat per bar.
This means the better choice depends on which comparison matters to the shopper.
Someone wanting a smaller portion may evaluate these products differently from someone looking for a more substantial snack.
No single number resolves every nutritional trade-off.
The protein-per-100-calories shortcut
One optional way to compare products is:
Protein per 100 calories = (protein grams ÷ calories) × 100
For Bar A:
12 ÷ 180 × 100 = approximately 6.7 grams of protein per 100 calories.
For Bar B:
15 ÷ 240 × 100 = 6.25 grams of protein per 100 calories.
This can describe protein relative to a food’s calorie content.
It does not establish whether the food is balanced, nutritious, appropriate for weight management, or suitable for a medical condition.
It also should not become a reason to avoid foods such as nuts, seeds, and other nutrient-rich foods that provide fat and energy alongside protein.
Treat it as a comparison tool, not a health score.
What Does “High Protein” on the Package Actually Mean?
Front-of-package claims deserve closer attention than ordinary descriptive language.
In the United States, claims such as “high” and “good source” have regulatory meaning when used as nutrient-content claims.
For protein, those claims are connected to the applicable Daily Value and protein-quality-adjusted labeling requirements.
Broadly, a “good source” nutrient-content claim corresponds to 10–19% of the Daily Value, while a “high” claim generally corresponds to 20% or more, subject to the relevant rules and reference amounts.
That is different from simply printing a factual statement such as “12g protein” on the front of a package.
If a product uses a protein claim, look for the corresponding Nutrition Facts information rather than relying on the size of the lettering.
You can consult the federal nutrition-labeling regulation, 21 CFR § 101.9 for the requirements governing protein declarations.
Does adding protein make a food healthy?
Not automatically.
A food can contain additional protein while also having substantial added sugar, saturated fat, sodium, or other characteristics that matter to your dietary needs.
Likewise, a food does not need to display a protein claim to contribute useful protein.
Beans, eggs, dairy foods, soy products, seafood, and many other ordinary foods can be part of a balanced eating pattern without being marketed as “protein products.”
The bigger objective is to evaluate foods within an overall healthy eating framework, rather than judging their quality through a single nutrient.
Where Protein Labels Commonly Lead Shoppers Astray
The most common mistakes involve comparisons that look fair but are not.
Comparing a single serving with an entire container
A drink may contain two servings even though the bottle looks like something you would finish at once.
Check servings per container.
If you consume the whole package, account for all servings when estimating protein, calories, and other nutrients.
Comparing a dry product with a prepared product
Some food packages distinguish between the product as sold and the food after preparation.
Milk added to cereal, for example, contributes protein that is not present in the dry cereal alone.
Do not assume the prepared-meal numbers describe the cereal by itself.
Treating protein grams as the whole nutrition story
A protein-enriched snack and a minimally processed food can deliver similar protein amounts while differing in fiber, fats, vitamins, minerals, ingredients, and energy content.
Neither processing status nor protein quantity alone tells you everything necessary.
Treating the ingredient list as a protein calculator
Ingredients are generally listed in descending order of weight, with applicable exceptions.
But ingredient order does not tell you the precise number of protein grams contributed by each ingredient.
Use the Nutrition Facts panel for declared nutrient amounts.
Use the ingredient list to understand what ingredients are present and to identify ingredients relevant to allergies, preferences, or restrictions.
How to Check Protein in Foods Without a Nutrition Facts Label
Not every protein-containing food arrives in a labeled package.
Fresh produce, foods prepared at home, and many other items may not have a Nutrition Facts panel available.
For those foods, a credible nutrient database can provide a reasonable reference.
The USDA FoodData Central database contains nutrient information for a wide range of foods.
When using it:
- Search for the correct food.
- Match the preparation method when possible.
- Check whether the amount is based on 100 grams or another portion.
- Adjust the quantity to the amount you actually eat.
- Remember that nutrient values can vary by product, preparation, and natural food composition.
For example, the protein content of cooked lentils should not be estimated from the same weight of dry lentils without accounting for the change in water content.
A packaged branded product’s current label is usually the more directly relevant source for that exact product.
A Two-Minute Grocery Aisle Decision Framework
Here is a reusable way to compare products without turning grocery shopping into a detailed nutritional analysis.
First: Match the products
Ask whether the two foods serve a similar purpose.
Comparing two plain yogurts is different from comparing yogurt with a protein bar.
Second: Normalize the portion
Check serving size and servings per container.
Where useful, calculate protein per 100 grams or per typical portion.
Third: Read beyond protein
Look at calories, saturated fat, added sugars, sodium, and fiber as relevant to your needs.
Do not assume that a high-protein claim means the other numbers are favorable.
Fourth: Check ingredients and dietary suitability
Read ingredient and allergen information, particularly when food allergies or medically necessary restrictions apply.
Fifth: Consider value and practicality
A product that supplies a little more protein at a much higher price may not be worthwhile for your usual diet.
Taste, affordability, accessibility, and how often you will actually eat the food matter too.
The final decision should reflect the whole food and the role it will play in your meals—not the protein headline alone.
How This Applies to Protein Shakes and Breakfast Foods
The same comparison rules apply when protein becomes the selling point of a beverage or a breakfast product.
A bottled shake may contain 20 grams of protein while another product supplies 30 grams, but those figures are not enough to determine which better fits your needs.
Check serving size, calories, ingredients, and other nutrients.
For a closer look at the specific ingredients used in protein drinks, our guide to what goes into protein shakes provides additional context.
If you are comparing the quantities shown on different shake products, see how much protein is in a protein shake.
Food-first breakfasts work the same way.
You can combine ordinary foods and verify the amount of protein in the portions you use, rather than assuming a recipe is high in protein because it contains nuts, oats, seeds, or eggs.
Our food-first breakfast builder demonstrates how to approach that task without relying on protein powder.
When Nutrition Label Comparisons Are Not Enough
Nutrition-label literacy is useful for everyday food decisions, but it is not a replacement for individualized dietary guidance.
Someone with chronic kidney disease, for example, may have specific protein recommendations depending on their medical circumstances and treatment.
People with food allergies, metabolic conditions, gastrointestinal disorders, or other medically relevant restrictions may also need to consider more than a general nutrient comparison.
Pregnancy, childhood, aging, and intensive athletic training can change nutritional priorities.
If you have a prescribed eating plan, follow your clinician’s or registered dietitian’s recommendations rather than treating the FDA’s general labeling reference as your individual target.
Frequently Asked Questions
Why do some protein labels show grams but no percent Daily Value?
For many conventional foods intended for adults and older children, manufacturers are not generally required to display protein %DV unless specific labeling rules apply, such as certain protein claims. The absence of a percentage does not mean the food lacks protein. Use the listed grams and serving size for comparison.
Is 20 grams of protein always better than 10 grams?
No. The amounts may refer to different serving sizes, and the products may differ in calories, fiber, saturated fat, sodium, and added sugars. A higher protein number can be useful, but it does not independently establish overall nutritional quality or determine whether the food suits your needs.
Can I calculate protein percent Daily Value by dividing grams by 50?
Dividing grams by 50 gives a simple unadjusted percentage of the general reference amount, but it may not match the regulated protein %DV on U.S. food labels. Protein %DV calculations can account for protein quality, so use the declared percentage when available rather than substituting your own calculation.
Read the Whole Label Before Choosing the Protein Number
Learning how to read protein on nutrition labels is less about memorizing a target and more about asking the right questions.
How much protein is in the portion you will actually eat? Are the products being compared on an equivalent basis? What else comes with that protein?
Those questions are more useful than the biggest number printed on the front of the package.
Start with serving size, verify the protein grams, understand what %DV means, and judge the food in context.
That approach works whether you are choosing yogurt, cereal, a snack bar, a milk alternative, or an occasional protein shake.